Electric Vehicles - the need for battery
From time immemorial, man has been inventing newer machines to improve his living comfort and to have more productivity in factories. Electric vehicles were born around the middle period of the 19th century and modern Electric vehicles/Hybrid Electric vehicles were developed at the end of the 20th century. These Electric vehicles were seen as more comfortable and easier to operate compared with the ICE engine vehicles. But now the latter has created an environmental problem. In today’s quest to safeguard our environment and to have more ways to use sustainable and renewable energy sources, the automobile industry has the most important role to perform.
This industry is the most polluting in terms of tailpipe emissions from their products. Battery industries also have an important role to play. More and more batteries are used for applications like electric vehicles (Electric vehicles), renewable energy sources (RES) like solar and wind energies. Electric propulsion through batteries helps in reducing the pollution level in the atmosphere as well as operating costs. Moreover, it also reduces dependence on crude oil. Electric propulsion of vehicles is the most talked about topic today.
All auto manufacturers have their own design of electric vehicles and Electric vehicles batteries (EVB). Although the lead-acid battery was the most widely used EVB until recent times, Li-ion battery now has taken over the leading role. But considering the initial cost and safety aspects, the lead-acid battery cannot be dethroned completely until the cost of the Li-ion Electric vehicles battery pack comes down to an affordable level and the safety aspects are improved further.
All auto manufacturers have their own design of electric vehicles and Electric vehicles batteries (EVB). Although the lead-acid battery was the most widely used EVB until recent times, Li-ion battery now has taken over the leading role. But considering the initial cost and safety aspects, the lead-acid battery cannot be dethroned completely until the cost of the Li-ion Electric vehicles battery pack comes down to an affordable level and the safety aspects are improved further.
Around the year 2010, the number of EVs on the roads stood at far less than 20,000 in the world. However, in the year 2019, the number had gone up by more than 400 times and was near seven million.
Nearly 80% of the air quality problems are related to automobile emission. In the industrialized countries of the West and Japan, it has been established that two-thirds of the CO, one-third of the nitrogen oxides, and nearly half of the hydrocarbons were due to the above-mentioned emissions. When such was the case with industrialized nations, it was no better in developing countries where environmental controls were not strictly enforced.
Inefficient ICE vehicles contributed significantly to air pollution even though the traffic density was lean. Apart from the above reasons, vehicular emissions produce large quantities of the “greenhouse gas” (GHG) i.e., CO2. On average, a car will produce nearly four times its weight of CO2. Vehicular emissions are responsible for 20, 24, and 26 per cent of all emissions of CO2 in the U.K, the USA and Australia, respectively. All these reasons and oil crises of the 1960s and 1970s and 1973 and 1979 were the real reasons behind the development of Electric vehicles and suitable Electric vehicles batteries.
Electric Vehicles - zero emission
An electric vehicle uses one or more electric motors powered by batteries alone for traction purposes (Pure Electric vehicles) with no internal combustion engine (ICE) whatsoever. Hence it has no tail-pipe emissions and so-known as or zero-emission vehicle (ZEEV). Hybrid electric vehicles (HEV) has two power sources, one with a high energy content (fossil fuel) and the other is a high-discharge rate battery.
The topic of Electric vehicles and its variants is a vast one and shall be dealt with in detail separately. Suffice it here to know the brief definition of Electric vehicles and HEV.
Components of Pure Electric Vehicles
I. Electrical Energy Storage (Battery)
II. Electronic control module (ECM)
III. A battery management system (BMS )
IV. Electrical Drive train
Every electric car has a range indicator, and the range is displayed prominently on the dashboard. In some Electric vehicles, lights start flashing when about 25 km of a range is left.
Components of a Conventional Hybrid Electric Vehicles
I. Electrical Energy Storage (Battery)
II. Chemical Energy Storage (Fuel tank)
III. Electrical Drive train
IV. Combustion Drive train
An introduction to batteries for electric vehicles
Characteristics required of an Electric Vehicle battery
There are several characteristics required of an Electric vehicles battery, but the following are of prime importance and provide a reasonably accurate assessment of battery feasibility.
a. Initial purchase cost of the battery pack (cost per kWh, including all paraphernalia)
b. Specific energy, which is an indicator of the size of the battery (Wh/kg)
c. Specific power, which is an indicator of acceleration and hill-climbing ability (W/kg)
d. Operating cost (cost/km/passenger)
e. Long cycle life with maintenance-free characteristics
f. Rapid rechargeability (80% within 10 minutes)
g. Ability to absorb high currents during regenerative braking.
h. Safety, dependability, and ease of recyclability.
Electric vehicles & Hybrid electric vehicles
In pure Electric vehicles, the power is to be supplied by the battery on a continuous mode. The energy capacity of the battery is so designed that it can supply this continuous discharge rating for the total designed range of the Electric vehicles. Usually, the Electric vehicles battery is not permitted to discharge beyond 80% of the capacity, so that its state of charge (SOC) will not drop below 20 to 25 %.
Electric vehicles battery range
This is to safeguard the battery against over-discharge and to avoid difficulties encountered in case the battery gets over-discharged. Moreover, the battery should also be able to accept the energy input from the regenerative braking system. If the battery is fully charged, the regenerative braking energy cannot be accepted by the battery.
The current trend in the above-mentioned continuous discharge rate is one time the capacity rating. For example, if the capacity rating is 300 Ah, the discharge rate is 300 amperes. Invariably, an Electric vehicles battery will experience full discharge once in a day. Of course, it will receive the return energy from regenerative braking as when applied.
The mean percentage of regenerative energy is about 15%. This figure may go up to more than 40 % in some cases. The regenerative power does not go beyond 40 kW. Its highest value is at a particular deceleration.
Nowadays, Electric vehicles battery manufacturers claim a cycle life of about 1000 to > 10,000 cycles.
An electric car battery nominally requires a 36 to 40 kWh (usable energy capacity) battery for a round-trip range of 300 to 320 km. But most of the OEM makers specify more than this value, typically, 40 to 60 per cent more. This will compensate for the lowering of life due to cycling so that even after the warranted battery life, there is a safe margin of capacity for a normal operation of an EV. The 96-kWh battery in an EV has a usable capacity of 86.5 kWh.
Although today’s Li-ion cells easily deliver 170 Wh/kg specific energy, the pack’s specific energy comes down by 35 %. As a result, the overall specific energy reduces to 120 Wh/kg. In 2019, the pack percentage of non-cell components has come down to about 28% from about 35%. But technology innovations like cell-to-pack technology (eliminating the middle agent, the module) may further improve the specific energy of the future EV batteries. The current specific power characteristics of EV batteries is highly satisfactory and hence the R&D engineers and scientists are aiming at higher specific energies.
Electrical drive train in electric vehicles
Traction motors power all-electric vehicles. But there are controllers for manipulating the performance of the electric motors. There are two types of electric motors, AC and DC motors. The latter is easier to control and also are less costly; the disadvantages are their heavier weight and larger volume. The rapid advances in power electronics have added highly efficient AC motors with a wider window of operational range, but, with attendant higher cost. In the EV, the energy input to the motor is controlled by the highly complicated electronic circuit called electronic control module (ECM). The EV operator gives the input through the accelerator pedal.
Battery management system (BMS) in electric vehicles
Similar to the above-mentioned electronic control module, there is a control system for battery also, called a battery management system (BMS), which controls the performance of the EV battery. The BMS may also have separate electronics installed at the cell or module levels which monitor the temperature and voltage of the cells, often referred to as a voltage temperature monitor (VTM) board.
In addition to these, there will be a thermal management system, which may range from a passive solution such as using the enclosure as a thermal heat sink to an actively managed liquid- or air-cooled system that forces cooled (or heated) air or liquid through the battery pack. Switches to turn the current flow on and off and wiring are also part of the system. All of these different systems must come together into a single system solution for the battery function safely and meet its life and performance expectancies.
History of Electricity, Batteries, and Electric Vehicles
Electricity and Batteries
Why should we discuss the history of electric battery and electric vehicles? There is an old saying: “those who cannot remember the past are condemned to repeat it”. Hence it is worthwhile to have a basic understanding of how the technology evolved. This will play an important role in understanding its future path and what were the key stakeholders in making it truly successful. As stated by John Warner in his book on Li-ion batteries, “World Fairs of the time provide a good representation of the speed of technological innovation and change in the world in general” [1. John Warner, The Handbook of Lithium-Ion Battery Pack Design, Elsevier, 2015, page 14].
One can understand that world fairs provided a picture of those days about the status of different technologies. The development in battery technology was made possible only because of the availability, expansion, and growth of electricity and the network of electricity of those days. Here we have to understand that only because of the electricity “supply” the “demand” for the battery (energy storage) was created. Otherwise, energy storage may not have emerged at all.
Development of batteries for electric vehicles
Readers generally think of batteries as being one of recent invention; they mostly know about Leclanché cells and lead-acid cells; however, there is evidence that batteries were in use in about 250 BC. In the 1930s, a German archaeologist was working on a construction site in Baghdad and found something that quite literally rewrote the history of the battery What he discovered during the dig looked like a galvanic cell capable of generating about 1–2 V of electricity.
Until the mid-1700s little progress was made on battery development. It was in 1745-1746 that two inventors, in parallel but separate tracks, discovered what became known as the “Leyden” jar to store electricity. Then Electrochemists like Benjamin Franklin, Galvani, Volta, Ampere, Faraday, Daniel, and Gaston Planté, to mention a few inventors, appeared in the horizons of Electricity and Electrochemistry. The following table illustrates in chronological order the developments of batteries.
Fascinating History of the development of batteries
Table 1 –
| About 250B.C. | Baghdad or Parthian Battery (Baghdad) | Egyptians probably used batteries to electroplate silver on fine jewellery |
|---|---|---|
| LONG GAP | AND LITTLE PROGRESS | |
| 1600 | Gilbert (England) | Establishment of electrochemistry study |
| Oct 1745 | Kliest, German Physicist | Leyden Jar |
| 1745-1746 | Dutch scientist Pieter van Musschenbroek of Leyden University, | Leyden Jar |
| Mid-1700s | Benjamin Franklin | The term "battery" coined |
| 1786 | Luigi Galvani (1737-1798) | Foundations for the discovery of a primary battery were laid ("Animal Electricity") |
| 1796 | Alessandra Volta (1745-1827) | Discovered that different metallic disc ("Volta pile") when stacked in an alternating fashion with moist paste board separators (saturated with brine) being interposed between them, could provide significant electrical current continuously |
| 1802 | Cruickshank (1792 - 1878) | Arranged sheets of Cu with equal sized sheet sizes of Zn in a sealed box. Brine was the electrolyte. |
| 1820 | A.M. Ampere (1755 - 1836) | Electromagnetism |
| 1832 & 1833 | Michael Faraday | Faraday's laws |
| 1836 | J F Daniell | Cu in CuSO4 and Zn in ZnSO4 |
| 1859 | Raymond Gaston Plantae (1834-1889) (France) | Invention of the lead-lead dioxide cell |
| 1860 | Raymond Gaston Plantae (1834-1889) (France) | Presentation to French Academy, Paris |
| 1866 [5] | Werner von Siemens of German electrical engineer | Development of electromechanical dynamo |
| 1873 | Zenobe Gramme, a Belgian Scientist | Invention of magneto electric generator and first DC motor |
| 1866 Geroge-Lionel Leclanche | Geroge-Lionel Leclanche (France) (1839 - 1882) | Invention of the Leclanche cell |
| 1881 | Camille A Faure (France) 1840 - 1898) | Pasting of leads grids |
| 1881 | Sellon | Sellon Alloying of lead with antimony |
| 1880s- | -- | Commercial productions were started in several countries like France, the UK, the USA & the USSR |
| 1881 - 1882 | Gladstone and Tribe | Double sulphate theory for lead acid cell reaction |
| 1888 | Gassner (USA) | Completion of the dry cell |
| 1890s- | -- | Electric road vehicles |
| 1899 | Jungner (Sweden) (1869-1924) | Invention of the nickel-cadmium cell |
| 1900 | In the USA and France | 1900 Lighting of houses, factories & trains. |
| 1900 | a.Phillipart with individual rings | Tubular lead-acid cell plates |
| 1900 | b.Woodward | Tubular lead-acid cell plates with tubular bags |
| 1901 | T A Edison (USA) (1847-1931) | Invention of the nickel-iron couple |
| 1902 | Wade, London | Book “Secondary Batteries” |
| 1910 | Smith | Slotted rubber tubes (Exide Ironclad |
| 1912 100 EV | In the USA | Manufacturers built 6000 electric passenger cars and 4000 commercial cars |
| 1919 | G. Shimadzu (Japan) | Ball mill for lead oxide manufacture |
| 1920 | -- | Use of lignins in the negative plates of lead-acid cells. |
| 1920 onwards | All over the world | Newer applications like emergency power supply, air conditioning of railcars and a host of other services on ships, aircrafts, buses and trucks |
| 1938 | A.E. Lange | Principle of oxygen cycle |
| 1943- 1952 | Levin & Thompson; Jeannin, Neumann & Gottesmann; Bureau Technique Gautrat | Construction of sealed nickel cadmium |
| 1950 | Gorge Wood Vinal | Book on Primary Batteries |
| 1955 | Gorge Wood Vinal | Book on Storage Batteries (4th Ed) |
| 1965 | John Devit of Gates Corporation | Project Proposal on sealed Lead-acid batteries |
| 1967 | Work on Ni-MH batteries began at the Batelle-Geneva Research Centre following the technology's invention in 1967 | |
| 1969 | Ruetschi and Ockerman | Recombination process in a sealed lead-acid cells |
| Mid 1970 | - | Development of VR LABs |
| 1971 | Gates Energy Products | D-cell, introduced by Gate Energy Products (Denver, CO, USA |
| 1973 | Adam Heller | Proposed the lithium thionyl chloride primary cell |
| 1975 | Donald H.McClelland and John Devitt | Commercial sealed lead-acid batteries based on the oxygen cycle principle |
| 1979 - 1980 | J.B. Goodenough and Co-workers | Positive electrode materials that react with lithium at potentials above about 3V, if they already contain lithium, and this lithium can be electrochemically extracted. |
| 1980s- | -- | New hydride alloys discovered in the 1980s |
| 1986 | Stanford Ovshinsky | The Ni-MH battery was patented by Ovonics. |
| 1989 - 1990 | -- | Commercialization of nickel metal hydride battery |
| 1991 | Yoshio Nishi | Li-ion cell |
| 1992 | Yoshio Nishi (Sony Corporation) | An EV with lithium-ion battery was exhibited at the 30th Tokyo Motor Show in 1995. |
| 1996 | Goodenough, Akshaya Padhi and co-workers | Proposed Li iron phosphate cathode material |
| 1992 | K.V. Kordesch (Canada) | Commercializing rechargeable alkaline manganese-dioxide cells (RAM) |
| 1993 | -- | OBC carried out the world’s first demonstration of an EV with Nickel-metal hydride battery in 1993. |
| 1997 | M. Shiomi and coworkers, Japan Storage Battery Co., Ltd., Japan | Addition of increased amounts of carbon on the negative HEV or photovoltaic power system applications. |
| 1999* | -- | Commercialization of Li-ion Polymer cells |
| 2002 - 2003 D. Stone, E. | M.J. Kellaway, P. Jennings, Crowe, A. Cooper | Multiple tab VRLAB |
| 2002 | Y. Ogata | New positive-grid lead alloy with Ba addition Pb–Ca–Sn with Ba |
| 2004 -2006 | Lam & co-workers, CSIRO Energy Technology, Australia | Ultra Battery for HEVs |
| 2006 | S.M. Tabaatabaai & Co-workers | Grid material formed of a three-dimensional reticulated sheet made of an organic foam compound. Electric conductivity imparted to the foam grid by using the copper plating |
| 2006 | Changsong Dai & Co-workers | Lead plated copper foam grids for negative plates |
| 2008 | EALABC, The Furukawa Battery Co., Ltd, Japan, CSIRO Energy Technology, Australia and Provector Ltd., UK | Ultra Battery (144V, 6.7Ah) for HEVs road-tested for 100,000 miles. Performance exceeded that of Ni-MH battery |
| 2011 | Argonne National Lab | Nickel-manganese-cobalt cathode material (NMC) |
| 2013 | N. Takami et al. | Lithium titanium oxide anode |
| 2018 | N. Takami et al | TiNb2O7 anodes |
| 2020 | BloombergNEF | LIB pack cost comes down to US$ 176/kWh = 127 cell cost + 49 pack cost) |
Amazing history of electric vehicles!!
The history of EVs is spread over a long period from 19th-century beginning.
The following table gives the details of the events that led to the present day EVs
Table 2
| Inventor | Country | Period | Details | |
|---|---|---|---|---|
| 1 | Anyos Istvan Jedlik | Hungarian physicist | 1828 | The first electric model car |
| 2 | Thomas Davenport | An American inventor | 1834 | The first commercially successful electric motor |
| 3 | Sibrandus Stratingh and Christopher Becker | Dutch professor | 1834-1835 | 1835, Steam tricycle in 1834 1835 An all-electric tricycle equipped with one of the first batteries |
| 4 | Robert Davidson | Scottish inventor | 1837-1840 | Constructed his own batteries in 1837 and made his first fair-sized electric motor. |
| 5 | Gustave Trouvé | 1881 | Improved a small electric motor developed by Siemens with a Starley accumulator. He installed this engine on an English tricycle, thus he had just invented the first EV in history. | |
| 6 | William Morrison | The USA | 1892 | Developed his six-person, four-horsepower carriage that could achieve a maximum speed of about 14 miles/h |
| 7 | Henry Ford | Detroit | 1893 | In 1893, successfully tested a gasoline engine [https://www.history.com/topics/inventions/model-t]. |
| 8 | Henry G Morris and Pedro G Salom | Philadelphia | 1894 | The Electrobat offered a lucrative business, compared with the horse-driven cabs due to its lower downtime and more trips |
| 9 | Bell Laboratories, | The USA | 1945 | Invented thyristors which quickly replaced vacuum tubes |
| 10 | William Shockley | Bell Laboratories, | 1950 | The silicon controlled rectifier (SCR) or thyristor |
| 11 | Moll and other Power engineers | General Electric | 1956 | SCR by William Shockley |
| 12 | General Motors (GM) | General Motors (GM) | 1966 | Electrovan |
Fun facts on electric vehicles!!
| Srl No | Details |
|---|---|
| 1 | In the USA electric car race attracted many enthusiasts from 1897. In that year, Pope Manufacturing Company had made about 500 EVs. |
| 2 | The first three decades of the 20th century (1910-1930) were the best periods for EVs. During this period electric vehicles competed with gasoline vehicles With the unpaved roads of the-then US cities, their small driving ranges were not at all a problem. But, in Europe, because of the paved roads improving the long-distance travel, the public wanted long range cars, which the ICE vehicles were ready to offer. |
| 3 | The large US cities began to enjoy the benefits of electricity in 1910s. Small driving ranges were favourable for EVs in those days. The EVs had an easy market acceptance with fleet owners for taxis and delivery vans. |
| 4 | Three important events in the history of ICE vehicles gave impetus to their rapid development and simultaneously, put in place the last nail in the coffin of EV. a. The introduction of Henry Ford's “low-cost, high-volume” Model T in 1908. [https://en.wikipedia.org/wiki/Ford_Model_T] b. Charles Kettering inventing the electric automobile starter in 1912. c. The US highway system began connecting American cities |
| 5 | The environmental concerns of 1960s and 1970s gave tremendous impetus to R & D works on EVBs. The range and performance were still the obstacles to be surmounted |
| 6 | Again the oil crises of 1973 and 1979 gave still more encouragement to the EVB development. |
| 7 | The huge population of ICE vehicles created air-quality problems by violating air quality standards. This was particularly so in the advanced cities of the world. This prompted the State of California, USA, in early 1990 to adopt the Clean Air Act for the promotion of EVs. |
| 8 | The Clean Air Act originally mandated that 2% of all the new light-duty vehicles sold in the state shall be ZEV by 1998 (30,000 EVs), 5% in 2001 (75,000) rising to 10% in 2003 (1,50,000). Apart from this, in the states which do not follow California's programme, the auto manufacturers must reduce tail-pipe emission of NOx and total hydrocarbons by 60% and 39% respectively, between 1994 and 1996 in the light-duty vehicles. A further 50% reduction in emission was be required by the Environmental Protection Agency (EPA) in 2003. |
| 9 | On 29th March 1996, the California Air Resources Board's (CARB) 1998 ZEV mandate was softened as a result of strong pressure from the adversely affected auto manufacturers and oil suppliers oreover, an independent panel's assessment that advanced batteries could not be made available until the year 2001 was also another reason. True to the above panel's assessment, such improved batteries were available at somewhat affordable cost only recently in 2018 (Pack cost US$ 176/kWh = 127 cell cost + 49 pack cost). Battery professionals predicted the EVB cost would come down to < 100 USD /kWh by 2025 and USD 62/kWh by 2030 (by extrapolation) |
| 10 | The United States Advanced Battery Consortium (USABC): The Federal Government of the USA and the three major US automobiles manufacturers (Chrysler, Ford and General Motors) decided to pool their resources (approximately US $262 million) into battery research over a period of 3 years. These manufacturers, along with other organizations like the Electric Power Research Institute (EPRI) have established the United States Advanced Battery Consortium (USABC) in the year 1991, in which the Government of the USA an equal funding. |
| 11 | USABC formulated two sets of goals for the EV batteries (Table 3 ) intending to develop an interim battery pack for the first phase (1994-95) and a long-term target so that the EV performance will be competitive with the IC engine vehicles. |
| 12 | Advanced Lead Acid Battery Consortium (ALABC): ALABC [5. R.F. Nelson, The Battery Man, May 1993, pp. 46-53] was set up in March 1992 to manage a 4-year Research Plan with a fund of US $ 19.3 million (Rs.48 crores approximately) for the development of high-performance EV lead-acid battery that will serve a significant share of the EV market in the short to mid-term. The ALABC is managed by the International Lead Zinc Research Organization (ILZRO) and is a partnership organization among fourteen largest lead producers, twelve battery manufacturers, electric utilities, motor manufacturers, charger and coupling manufacturers, power-train suppliers, controller/ electronics manufacturers, and EV trade organizations. |
| 13 | From 1991, Cooperative R&D Agreements were finalized between the Vehicle Technologies Office (VTO) of The Department of Energy's (DOE's) the United States Advanced Battery Consortium (USABC). |
| 14 | Annual Li-ion battery market size may rise from 25 Billion $ (2019) to 116 Billion $ (2030). |
| 15 | Cost of battery pack comes down from 1100 $/kWh to 156 in 2019 and is projected to 62 $/kWh in 2030. (BloombergNEF) |
Nickel Metal Hydride Battery Technology for electric vehicles
The invention of the Ni-MH battery system is a derivative of both Ni-Cd and Ni-H2 batteries. The Cd in the Ni-Cd system is considered a hazardous material. The associated advantages of the new system were the higher specific energy, lower pressures required and the cost of Ni-MH cells. The work was supported by two German auto makers over a period of 20 years
Energy producing electrochemical reactions:
There is a lot of similarity between Ni-Cd and Ni-MH cells, except for the negative electrode. As in the case of Ni-Cd cells, during discharge, the positive active material (PAM), nickel oxyhydroxide, is reduced to nickel hydroxide. (Thus, the positive electrode behaves as a cathode):
NiOOH + H2O +e– Discharge↔Charge Ni(OH)2 + OH– E° = 0.52 Volt
The negative active material (NAM), reacts as given below: (Thus the negative electrode behaves as an anode):
MH + OH– Discharge↔Charge M + H2O + e– E° = -0.83 Volt
That is, desorption of hydrogen occurs during discharge.
The total reaction during discharge is
NiOOH + H2O + e– Discharge↔Charge Ni(OH)2 + OH
MH + OH– Discharge↔Charge M + H2O + e–
NiOOH + MH Discharge↔Charge Ni(OH)2 + M E° = 1.35 Volts
Please remember that
Cell voltage = VPositive – VNegative
Therefore 0.52 – (-0.83) = 1.35 V
Here it is to be noted that water molecules shown in the half cell reactions do not appear in the overall or total cell reaction. This is due to the electrolyte (aqueous potassium hydroxide solution) not participating in the energy-producing reaction and it is there only for conductivity purposes. Also, note that the aqueous solution of sulphuric acid used as an electrolyte in the lead-acid cells actually is participating in the reaction as shown below:
PbO2 + Pb + 2H2SO4 Discharge↔Charge 2PbSO4 + 2H2O
This is an important difference between lead-acid cells and alkaline cells. The reverse process occurs during the charge reaction.
The sealed nickel-metal hydride cell uses an oxygen-recombination reaction similar to the one occurring in valve-regulated lead-acid (VRLA) cells, thus preventing the unwanted increase in the internal pressure which results from the generation of gases towards the end of the charge and particularly during overcharge.
During charge, PAM reaches full charge before the NAM and so the positive electrode begins to evolve oxygen.
4OH– → 2H2O + O2 + 4e–
The gas thus evolved from the above reaction travels through the porous matrix of the separator to the NAM aided by the starved of electrolyte construction and by employing a suitable separator.
Because the O2 combines with the MH electrode to generate water on the negative electrode, the pressure build-up inside the battery is prevented. Even so, there is a safety valve in the case of an extended overcharge or charger malfunctioning.
4MH + O2 → 4M + 2H2O
Moreover, by design, the NAM is never allowed to come to full charge, thus preventing the possibility of hydrogen production. Additionally, it is very important to follow an intelligent charge algorithm to restrict the O2 generation beyond the capability of the cell’s recombination efficiency. This is also achieved by careful control of the two active materials proportion.
Readers can refer to the following for a detailed account of the Ni-MH batteries
a. Chapter on Ni-MH batteries by Michael Fetcenko and John Koch in the Handbook
b. Kaoru Nakajima and Yoshio Nishi Chapter 5 in: Energy Storage Systems for Electronics.
Lead acid battery technology in electric vehicles
The Advanced Lead Acid Battery Consortium (ALABC) [7. J.F. Cole, J. Power Sources, 40, (1992) 1-15] was set up in March 1992 to manage a 4-year Research Plan with a fund of US $ 19.3 million (Rs.48 crores approximately) for the development of high-performance EV lead-acid battery that will serve a significant share of the EV market in the short to mid-term.
ILZRO managed this consortium and is a partnership organization among the fourteen largest lead producers, twelve battery manufacturers, electric utilities, motor manufacturers, charger and coupling manufacturers, power-train suppliers, controller/electronics manufacturers, and EV trade organizations. The membership currently stands at 48, hailing from 13 countries. The ALABC (now CBI) has five critical research and development goals which have been included in Table 3. Advanced lead-acid batteries are capable of providing electric vehicles with daily commuting ranges of 90 miles or more, recharging times of a few minutes, and lifetimes of approximately 3 years.
The state of the technology of ALABC in 1998 indicates that, with the projects currently in train, valve-regulated lead-acid batteries with a performance characteristic of 48 Wh/kg, 150W/kg, a fast charge of 80% in 10 minutes, and cycle life of 800 are on schedule for development before the end of 1998. The achievement of such a performance will represent a spectacular advance by the lead-acid battery community during the course of the 1990s and offers the prospect of an electric automobile with a range per charge of over 100 miles, repeatable several times within a day and over 500 times during the lifetime of a battery pack [https://batteryuniversity.com/learn/article/battery_developments]
Lithium-ion batteries in electric vehicles
The history of the development of lithium-ion batteries
Table 3:
| Research Work | Inventor / Author | Year | Affliation | Remarks |
|---|---|---|---|---|
| Discovery of the high ionic conductivity of the solid phase NaAl11O17, called sodium β-alumina, leading to Na-S battery system | Kummer and co-workers | 1967 | Ford Motor Co. laboratory | Li-ion cell’s history commenced |
| Na-S battery system | N. Weber and J.T. Kummer | 1967 | Ford Motor Co. laboratory | High-temperature system |
| FeS or FeS2 studied as cathode materials vs. Li metal | D.R. Vissers et.al. | 1974 | ANL | Upon reaction with Li, these materials undergo reconstitution reactions, with the disappearance of the initial phases and the formation of new ones |
| Li metal anode and titanium sulphide (TiS2) cathode | Prof. Whittingham | 1976 | Binghamton University, Binghamton, New York 13902, United States | Li formed dendrites at the metal surface on cycling, resulting in short-circuits. |
| Materials initially containing lithium, and electrochemically deleting lithium from them, were the work on Li1−xCoO2 in 1980. | Prof. Goodenough and co-workers | 1980 | Oxford University, UK | Li intercalation compounds |
| Special anode material based on coke | Akira Yoshino | 1985 | New anode material | |
| The above anode material was combined with LixCoO2 | Akira Yoshino | 1986 | Asahi Kasei Corporation | Li-ion cell |
| The safety of Li-ion battery proved | Akira Yoshino | 1986 | Asahi Kasei Corporation | Li-ion vs. Li metal anode safety proved |
| A commercial Li-ion battery in 1991. | 1991 | Sony Corporation | ||
| With further development, Li-ion battery was commercialised. | 1992 | A joint venture of Asahi Kasei and Toshiba. | ||
| Newer cathode materials Li manganate and Li iron phosphate | Goodenough’s group | 1997 | Goodenough’s group | |
| Graphite anode | 1990 |
Li-ion Lithium cobaltate (LCO) cell chemistry
The total reaction is
C6 + LiCoO2 ⇄ LixC6 + Li1-xCoO2
Ecell = 3.8 – (0.1) = 3.7 V.
Li-ion cell of the LiFePO4 chemistry
The total reaction LiFePO4 + 6C →LiC6 + FePO4
Ecell = 3.3 – (0.1) = 3.2 V
Era of Modern Electric Vehicles
It was really not until the 1990s that the major automakers work on hybrid and electric vehicles solutions began to produce results. In parallel with these advancements, the first commercial lithium-ion batteries were introduced to the market in 1991 and were quickly adopted. With the rapid spread of personal electronics, these high energy-density batteries became the energy storage solution of choice for many different applications from portable electronics to hybrid and electric vehicles.
The modern era of EVs was precipitated by the oil shortages in the 1970s.
Developments of modern HEVs/Electric Vehicle
Table-4
| EV/HEV | Approx. Year | Remarks |
|---|---|---|
| General Motors’ (GM) EV1. | 1996-1999 | EV 1 |
| Parallel Hybrid Truck” (PHT), | 1999 | |
| 2-Mode Hybrid System | 2008 | |
| “Belt-Alternator-Starter” (BAS)-type mild hybrid system | 2011 | 1. GM’s first BAS was a 36-V system with a Ni-MH battery developed by Cobasys. 2. The second generation (e-Assist) increased the voltage of the system to 115 V and changed to a 0.5 kWh Li-ion air-cooled battery designed by Hitachi Vehicle Energy Ltd |
| GM’s Voltec technology | 2010 | The Volt is a “series hybrid” that combines both a small ICE with a 355-V lithium-ion battery with cells from LG Chem and pack designed by GM and two electric motors. |
| Toyota Hybrid System (THS) | 1997 | Air-cooled 288-V Ni-MH battery with ~1.7 kWh of energy |
| All electric RAV4 SUV | 2006 | The second generation RAV4 EV battery, based on the Tesla Model-S battery pack had a 386-V Li-ion battery with about 52 kWh. |
| Honda Insight | 1999-2006 | a “two-seater, the highest fuel-economy gasoline - fuelled hybrid vehicle |
| Mitsubishi | 2009 | i-Miev |
| Mazda | 2000-2011 | hybrid options on their Tribute, Mazda3, and Mazda6 |
| Hyundai | 2012 | a hybrid Sonata, Tuscon, and Elantra |
| Kia | 2000 | A hybrid Optima |
| Subaru | 2007 | XV Crosstrek and a Stella Plug-in Hybrid. |
| Nissan | 2010 | Leaf |
| Ford | 2011 | 1. Focus EV uses a 23 kWh Li-ion battery (LG Chem); 2. C-Max (2012) |
| BMW | 2013 | e-Tron, i-8, and Active Hybrid |
| Chinese BYD, Beijing Automotive Industry Corporation (BAIC), Geely, Shanghai Automotive Industry Corporation (SAIC) Chang’an, Chery, Dongfeng, First Auto Works (FAW), Brilliance Automotive, Foton, Great Wall, Lifan, and many others | Later part of 2000s | . |
Today, EVs and HEVs are clearly here to stay. By the early 2030s, as technology continues to improve and the cost of batteries becomes easily affordable, the option for zero-emission EVs (ZEVs) will overtake all other options for vehicle owners.
The EV battery prices, which were above $1,100 per kilowatt-hour in 2010, have fallen 87% to $156/kWh in 2019. By 2023, average prices may reach near to $100/kWh.
Table 5
[2. Global EV Outlook 2020 (IEA) page 155, https://webstore.iea.org/download/direct/3007]
Electric vehicle Stock, Sales, Market share, Battery size, Range, etc.
| Year | 2010 | 2017 | 2018 | 2019 | 2025 | 2030 | Remarks |
|---|---|---|---|---|---|---|---|
| Sales (million) | 0.017 | 0.45 | 2.1 | ||||
| Sales (million) | 7.2 | 47 % in China in 2019 | |||||
| Stock Expansion | 60% | Has risen by an annual average of 60% in the period 2014-19 | |||||
| China’s share | 47% | ||||||
| Global car sales | 2.6% | ||||||
| Global Stock | 1% | ||||||
| Increase in % | 40% | Two reasons for increase:EV models with higher kWh batteries and hence higher ranges currently offered and expected The market share of BEVs relative to PHEVs is increasing. | |||||
| Average Battery Pack Size (kWh) | 37 | 44 | 20-30 kilowatt-hours (kWh) in 2012 | ||||
| Battery pack size (kWh) | 50- to 70 | 48 to 57 | 70 to 80 | For PHEVs approx. 10-13 kWh in 2018 (50-65 km of all electric driving range) and 10-20 kWh in 2030. Year 2019 -14 % increase wrt year 2018 | |||
| Average range (km) | 350 to 400 | ||||||
| Global Forecast | In 2019, Global forecast = 3 % market share |
| Year | Increase or Decrease (%) | |
|---|---|---|
| Percentage of Growth | 2016 to 2019 | 6% Increase |
| Percentage of Growth | 2016 to 2019 | 30% Decrease |
According to IEA, the Stated Policies Scenario (SPC) is a situation which incorporates the existing Governmental policies; and the Sustainable Development Scenario (SDC) is fully compatible with the Paris climate agreement goals. The latter includes the targets of the EV30@30 Campaign (30 % market share for EVs of all modes, except two wheelers by 2030).
In the SPC, the world EV stock (all modes, except two and three wheelers), increases from about 8 million (2019) to 50 million (2025) and very near to 140 million (2030, about 7%). Corresponding to an annual meange growth rate very near to 30%
EV sales reach almost 14 million (2025, equivalent to 10 % of all road vehicle sales) and 25 million (2030, equivalent to 16 % of all road vehicle sales).
In the SDC, the world EV stock reaches almost 80 million vehicles in 2025 and 245 million vehicles in 2030 (excluding two/three wheelers.
The EV30@30 Campaign was launched at the Eighth Clean Energy Ministerial in 2017. The participating countries are Canada, China, Finland, France, India, Japan, Mexico, Netherlands, Norway, Sweden and UK.
| Year | 2010 | 2011 | 2012 | 2013 | 2014 | 2015 | 2016 | 2017 | 2018 | 2019 | 2025 | 2030 |
|---|---|---|---|---|---|---|---|---|---|---|---|---|
| Annual Li-ion battery market size (Billion $) | -- | -- | -- | -- | -- | -- | -- | -- | 25 | 60 | 116 | |
| Cost of battery pack ($/kWh) | 1100 | -- | -- | 650 | 577 | 373 | 288 | 214 | 176 | 156 | 100 | 62 |
Figure 1.
Global annual Lithium-ion battery market size
https://www.greencarcongress.com/2019/12/20191204-bnef.html
The sales market size of LIBs for Electric vehicles may reach about 120 billion USD in 2030.
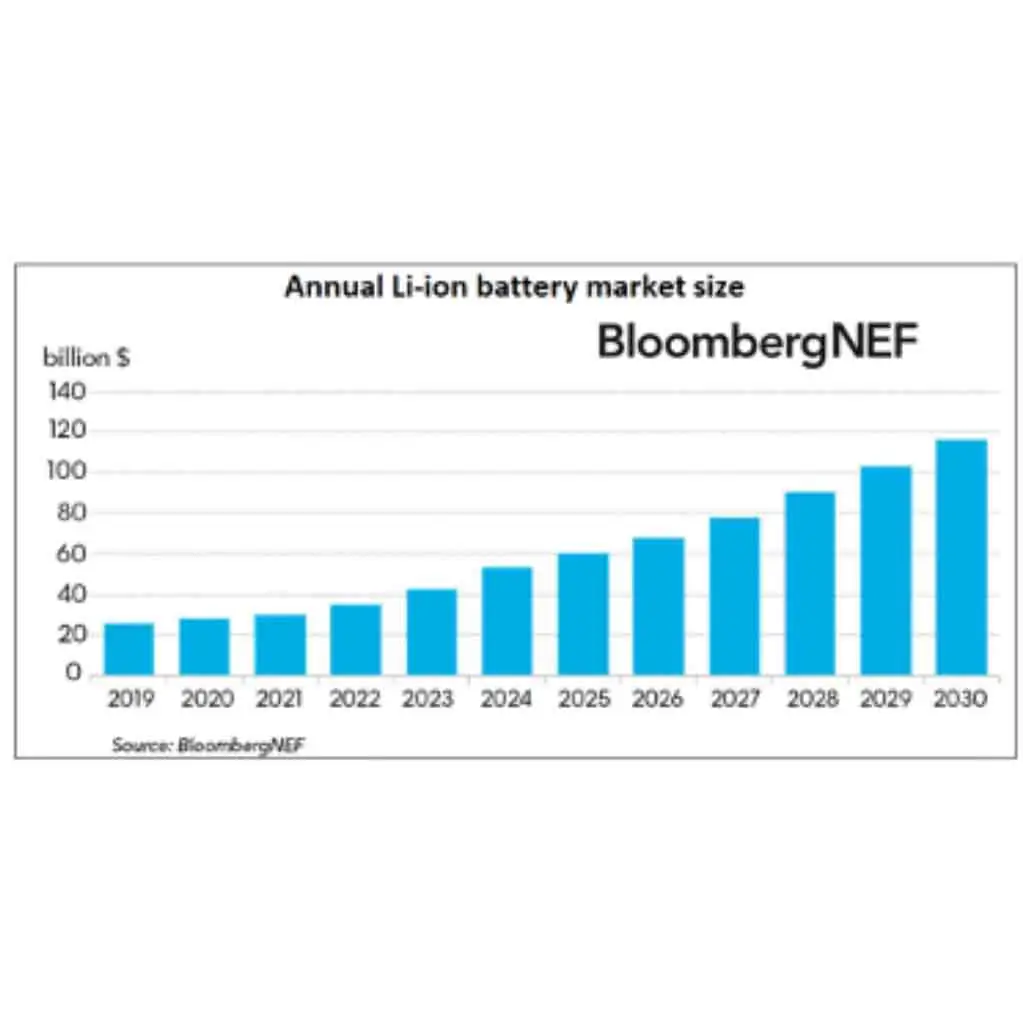
Battery prices, which were higher than USD 1,100 / kWh in 2010 and USD 288/kWh in 2016, came down to USD 156/kWh last year (2019) and after about four years, the average cost may be very near to USD 100/kWh, as reported by a market research company. One of the leading EV makers used the most easily available 18659 cell to bring down the cost to USD 250/kWh.
ANL formulated a calculation model (BatPac) for assessing the performance and production cost of lithium-ion cells for EVs. Using a particular type of cell chemistry of 80 kWh battery and a definite annual production capacity, the average battery prices were estimated to be in the range of 105 to 150 USD/kWh.
Examples of some EV battery packs
The EV consumer expects an 8-year warranty or a particular km limit on the batteries. A leading EV manufacturer offers 8 years warranty in addition to unlimited mileage.
Toshiba claims its battery will retain 90% kWh even after 5000 cycles equivalent to 14 years of recharge cycles at one cycle per day. Although Toshiba is talking about selling the battery in 2021, it does not claim cost.
The Tesla Battery Report (http://doc.xueqiu.com/1493d8803372d3fd67cb5c51.pdf) (Copyright: 2014 Total Battery Consulting, Inc.)
EV Battery packs (Copyright: 2014 Total Battery Consulting, Inc.) (http://doc.xueqiu.com/1493d8803372d3fd67cb5c51.pdf)
Global EV Charging infrastructure
A major portion of the light EV charger is owned by the consumers. China owns approximately 80 % of the public chargers as against 47 % of the global light-duty EV stock. Last year (2019) alone, the increase in public chargers in China was 60 % of the global public chargers and this country had 80% of world public chargers and 50 % of the publicly accessible slow chargers.
Table 7
Global EV charging infrastructure
[Global EV Outlook 2020 (IEA) https:// webstore .iea.org/download/direct/3007].
The vast majority of electric light-duty vehicle chargers are private chargers.
| Chargers available (million) | 7.3 | |||
|---|---|---|---|---|
| Private | Public | Fast Chargers | Slow Chargers | |
| 6.5 million ~ 80% | 0.876 million 12% (862 000) | 4% 263 000 | 8% 598 000 |
60 % increase Compared to 2018
Buses 2019
Chargers Available – 184000 units (increases by 17% in 2019 compared to 2018 (157 000)
Global Electric trucks charging infrastructure.
| Truck Type | Medium freight trucks (3.5 to 15 tones GVW) | Heavy freight trucks (>15 tones GVW) |
| Battery pack energy size | 70 - 300k Wh | 200 - 1000k Wh |
Indian Scenario: EV and EV charging Infrastructure
Indian EV stock
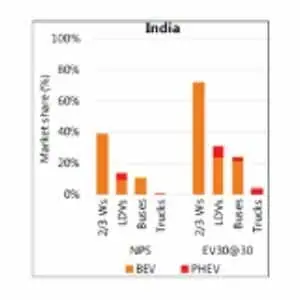
EVs share of sales across all modes in India reaches nearly 30% in 2030 in the New Policies Scenario, almost in line with its target (Government of India, 2018). Vehicle electrification is primarily in the two-wheeler segment with BEVs accounting for four-out-of-ten new units in 2030. EVs also penetrate the LDV and urban bus markets, reaching 14% of all passenger cars and LCVs, and 11% of all bus sales.
The deployment of EVs in India was spurred by the aim in 2017 of a full transition to electric vehicles by 2030. In 2018, a 30% target was established and is being supported by several policy measures such as standardization, public fleet procurements, and targeted economic incentives, both for vehicle uptake and charging infrastructure deployment.
In the EV30@30 Scenario, as a global frontrunner in the transition to electric mobility, India reaches EV sales shares across all modes (except two/three-wheelers) of 29% in 2030 (54% including two/three-wheelers). In 2030, in India 72% of two-wheelers, 31% of cars, and 24% of buses are electric. [ 8. Global EV Outlook 2020 (IEA) page 139, https://webstore.iea.org/download/direct/3007].
In India, West Bengal Transport Corporation (WBTC) added 80 electric buses and chargers through the first phase of the Governmental policy of encouraging the use of EVs called Faster Adoption and Manufacturing of Hybrid & Electric Vehicles (FAME I). Some of the nine-metre buses have 125 kWh battery packs and some of the longer (12 metres) buses have188 kWh battery packs.
Figure 3.
EV sales in India in the year 2030 [Global EV Outlook 2020 (IEA) page 159, https: // webstore. iea.org/download/direct/3007]
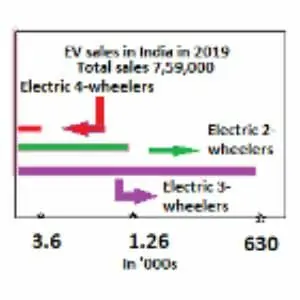
Last year (2019), Indian EV sales was 0.750 million units and the total stock reached about 7.59 million units. Last year the two-wheelers witnessed 130 % growth from 2018.
https://www.autocarindia.com/car-news/ev-sales-in-india-cross-75-lakh-mark-infy2019-412542 accessed on 6th Aug 2020 ).
In the prevailing circumstances, the 2-W makers learnt to support themselves sans Governmental subsidy. The drop in sales in April last year (2019) was due to the stringent stipulations of the second phase of (FAME II). No EV can meet the new criteria. Moreover, a recertification process consuming about 45 days delayed the sales.
EV charging infrastructure in India
Adequate EV charging infrastructure (EVCI) has been the key for the uptake of Electric Vehicles.
It has been proved that the availability of a strong network of Electric Vehicles Supply Equipment (EVSE) in a country has been three times more effective than providing rebates and subsidies on the purchase of an electric vehicle demand standpoint, both public and home charging infrastructure is critical to promote EVs. Globally, the public charging infrastructure has grown at a mind-boggling CAGR of 84% in the last decade with more than 100% YoY growth rates between 2009-2012 and 2013-2014 averaging around 180% YoY growth between 2010-2018.
Growth Trends for EV charging infrastructure in India
India is an emerging electric mobility market and as the world’s fourth-largest automotive market we are gradually becoming the focal region in Electric mobility.
The future of EVCI growth in India is dominantly positive and achieve global EVCI penetration growth rates.
Gensol Mobility, which owns and operates intra-city electric cab fleet, BluSmart, increased its presence in the national capital region.
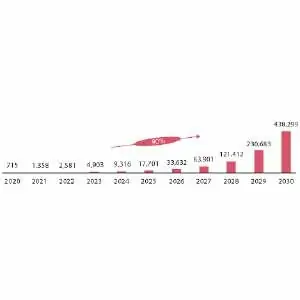
Figure 5
India Public EV Charging Infrastructure Growth Trend
India Public Electric Vehicles Supply Equipment (EVSE) slow and fast
Post-Li-ion or Beyond-Li-ion
To double the range, E-car makers are searching for newer type batteries. The following systems are being investigated:
a. Li solid-state batteries (http://www.usaspeaks.com/news/toyota-unveils-solid-state-battery-design-for-evs/)
b. Li-air (oxygen) batteries [ 11. David L. Chandler | MIT News Office]
c. Na-ion batteries
d. Zinc-air batteries [12. Jonathan Goldstein, Ian Brown and Binyamin Koretz JPower Sources, 80 (1999) 171-179].
e. Licerion Battery
EV Battery Pack Design
The number of cells in a pack will depend on the chemistry of the Li-ion cell, which in turn depends on the cathode material used.
Take, for example, an 85-kWh battery made from nickel-cobalt-aluminium (NCA) cathode type cells of 3.25 Ah capacity each:
Assumptions:
Battery pack voltage = 350 V
Nominal cell voltage = 3.6 V
Rated Energy capacity = 85 kWh
Actual Energy capacity = 80 kWh (~ 95 % of rated capacity)
Rated capacity = 3.25 Ah
Actual capacity = 3.1 Ah (~ 95 % of rated capacity)
For a 350-V pack and using the above cells, it would require 350 V/3.6 V = 97.2 cells, for simplicity round it off to 96 or 98 cells.
But the energy capacity of 96 single cells in series would be 96* 3.6 V*3.25 Ah = 1123 Wh. So, this particular module design would be 1123 Wh.
Hence, the number of cells to be connected in parallel = 85000Wh/1123 Wh = 75.7 @ 76.
We can connect 76 cells in parallel in one module, whose capacity will be 76*3.25 Ah = 247 Ah.
We can conveniently divide 96 cells into 16 modules of 6 cells each (or 12 modules of 8 cells each), all of which are in series.
So, the total voltage would be 16*6 =96 *3.6 V =345.6 V @ 350 V.
OR
The total voltage would be 12*8 =96 *3.6 V =345.6 V @ 350 V
Therefore, the total rated Wh of one module would be 247 Ah*6*3.6 V = 5335 Wh.
Therefore, the total rated Wh of the pack would be 247 Ah*6*3.6 V*16 = 85363 Wh @ 85 kWh
Therefore, the total actual Wh of the pack would be 76*3.1 Ah = 236 Ah*350 V = 82600 Wh @ 82 kWh
Now the energy capacity is 85 kWh. So, the total number of cells in a pack would be
85000 Wh/3.6 V*3.25 Ah= 7265 cells (Rated)
85000 Wh/3.6 V*3.1 Ah= 7616 cells (Actual)
In a similar manner, to achieve a 350-V pack using a 3.25-V lithium iron phosphate (LFP) cells we would need (350 V/3.25 V) 107.7 cells. Again, for simplicity, we may decide to use either 108 or 110 cells. Here we can design 11 modules of 10 cells each for 110 cells or 18 modules of 6 cells each for108 cells.
Or using a 2.3-V LTO (Lithium Titanate) cell we need (350 V/2.3 V) 152 cells or rounded to 160 cells in order to reach the desired voltage.
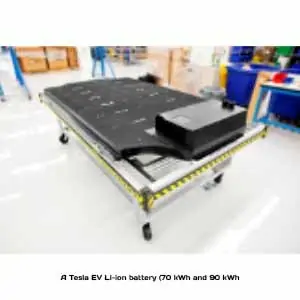
70 kWh and 90 kWh, 18650 NCA cells of 3.4 Ah; liquid-cooled.
90 kWh pack has 7,616 cells; battery weighs 540 kg (1,200 lb = 540 kg);
The probability of failure in parallel configurations is low and hence one-cell failure will not affect the whole battery.
Battery power and capacity calculations
Take the previous example of a battery pack of 85 kWh with a voltage of 350 V. Normally for EVs the 1C rate discharge is taken into consideration. So, the current would be 85000 Wh / 350 V = 243 Ah. Hence the current would be 240 A. The power = V * A = 350*240 = 84000 W = 84 kW maximum. But the BMS allows only 80 % of this power as the maximum.
Hence the actual power used will be 84*0.8= 67.2 kW. As mentioned earlier, the mean percentage of regenerative energy is about 15%. This figure may go up to more than 40 % in some cases. The regenerative power does not go beyond 40 kW.
Voltages of competing Lithium batteries
Table 8
| Performance parameter | NCA | NMC | LMO | LFP | LTO | LCO |
|---|---|---|---|---|---|---|
| Nominal Voltage of a cell (V) | 3.6 | 3.6 | 3.8 | 3.2 | 2.2 | 3.6 |
Specific energy and Energy efficiency
Assuming 25% efficiency, fossil fuel may deliver 12000*0.25 = 3000 Wh/kg usable energy. In the case of battery the efficiency is higher and so 150*0.9 = 135 Wh/kg usable energy is obtainable from batteries.
Usable ratio = 3000/135 = 22.22 times
Direct ratio = 12000/150 = 80 times
Recycling of Li-ion batteries
[ 14. Bin Huang Zhefei Pan Xiangyu Su Liang An, J Power Sources, Volume 399, 30 September 2018, Pages 274-286]
With the ever-growing need for LIBs, particularly from the EV segments, a large number of lithium-ion batteries will return for recycling or re-use. The lack of proper disposal of spent lithium-ion batteries probably results in grave consequences, such as environmental pollution and waste of resources. To address this issue, both technological innovations and the participation of governments are required.
Readers interested in more details can refer to the publications on this topic.
Second life batteries (Re-using EV batteries after EV end-of-life
In the recycling field, there are contemplation to either reuse the EV batteries after the EV battery is discarded or recycle the materials from this battery.
Electric Vehicles coming to India in 2020
The year 2020 will not only see manufacturers see focusing on BSVI compliant cars and motorcycles, but some will take an extra step to completely negate the carbon emissions and venture into the EV platform. The following are a few EVs that have been confirmed for this year and some are anticipated soon this year. They are:
Tata Nexon EV
G Motor India ZS EV
Audi e-Tron
Ford-Mahindra Aspire EV
Volkswagen ID 3
Jaguar I-Pace
Porsche Taycan 4S
The details available are tabulated below:
Table 9
Electric vehicles coming to India in 2020
(http://overdrive.in/news-cars-auto/cars-coming-to-india-in-2020-electric-vehicles/)
| EV (Wh consumed/km) | Price | Battery Type | kWh capacity | Usable capacity | Motors | Torque | Acceleration | Top speed | Range km | Remarks |
|---|---|---|---|---|---|---|---|---|---|---|
| Tata Nexon EV (100 Wh/km) | Rs. 15 to 17 L | Li-ion | 30.2 | Permanent magnet AC motor | 129PS and 245 Nm front wheels | 0 to 100 kmph in 9.9 s | NA | > 300 km on a full charge | ||
| GM ZS EV (129 Wh/km) | Li-ion | 44.5 liquid-cooled battery pack | 143PS/350Nm motor driving front wheels | 345 | On-board charger. Full charge in 6 to 8 h; Also 50 kW charger to be set up | |||||
| Audi e-tron (220 Wh/km) | Li-ion | 96 | 86.5 | Rear & Front motors | 436 | |||||
| Ford-Mahindra Aspire EV | Rs 6 to 7 L | Li-ion | Rear Axle Motor | 300+ | ||||||
| Volkswagen ID 3 (136 Wh/km) (138 Wh/km) (140 Wh/km) | < 30000 Euro | Li-ion | 45 (Base version) | 330 (WLTP) | 290 km in 30 minutes charge (100 kW DC) | |||||
| Rs. ~ 23.85 L before taxes and duties | Li-ion | 58 (Mid-spec) | 205PS and 310Nm | 160 | 420 | |||||
| Li-ion | 77 (Topmost spec) | 550 | ||||||||
| Jaguar I-Pace (180 Wh/km) | Li-ion | 90 | 2 motors | 400PS and 696Nm of torque | 0-100 km/h in 4.8 s | 320 | >500 | 80% Ch 90 minutes | ||
| Porsche Taycan 4S (195 Wh/km) | Li-ion | 79.4 | Dual Motor 800 V | 435PS, 530PS on over-boost, and 640 Nm. | 0 to 100 kmph in 4s. | 250 | 407 | |||
| Li-ion | 93.4 | 463 |