Standby Batteries & Float Charging
Batteries used in standby emergency power supply for telecommunication equipment, uninterrupted power supply (UPS), etc., are continuously charged (or floated) at a constant voltage equal to OCV + x mV. The value of x depends on the design and the Standby manufacturer. Usually, the float value will be 2.23 to 2.30 V per cell. A battery on float service is one subjected to continuous charge and is called on to perform only in case of power disruptions. This value of constant potential is sufficient to maintain them in fully charged condition. In addition to charging to compensate for the previous discharge, the constant potential (CP) charge compensates for self-discharge processes that occur when the battery is idle.
How does float charger work?
A float charger continually charges batteries at pre-set voltages irrespective of the state of charge. The appliance is not disconnected from the charger. The local conditions like power outages and ambient temperature will be considered to decide upon a more exact setting of the float voltage. The capacity is the most important aspect of this setting. The charger may also have a boost facility to prepare the battery for the next power shut down where there is frequent power shedding.
Charging conditions are:
- Charging type: Constant potential at 2.25 to 2.30 V per cell, with a temperature compensation of – mV to – 3 mV per Cell
- Initial current: Maximum 20 to 40% of the rated capacity
- Charge time: continuous, irrespective of the SOC
Some manufacturers say that charging of lead-acid batteries is most efficient in the range of 15-30°C and that no temperature compensation is required if the ambient temperature is in the range 0 to 40°C. Otherwise, a built-in temperature compensation circuit to enhance charge efficiency can be considered. Temperature compensation of minus 2 to minus 3 mV per oC per cell based on 20-25°C is desirable.
The following table is a guide for temperature compensation.
Table 1. Temperature compensation for float voltage for a 12 V battery
[http:// www. eastpenn-deka.com/assets/base/0139.pdf]
Temperature, °C | Float voltage, Volts | |
Optimum | Maximum | |
≥ 49 | 12.8 | 13 |
44-48 | 12.9 | 13.2 |
38-43 | 13 | 13.3 |
32-37 | 13.1 | 13.4 |
27-31 | 13.2 | 13.5 |
21-26 | 13.4 | 13.7 |
16-20 | 13.55 | 13.85 |
10-15 | 13.7 | 14 |
05-09 | 13.9 | 14.2 |
≤ 4 | 14.2 | 14.5 |
What is float charging and boost charging?
The charging equipment may be having two rates of charge normally. They are:
- Quick boost charging
- Trickle charging
Facilities are usually incorporated for quick boost facilities for recharging of the battery after an emergency discharge. The booster part invariably has an output up to 2.70 V per cell for recharging of the battery for a flooded type and up to 2.4 to 2.45 for VRLA batteries. The trickle charge output is capable of compensating for self-discharge and other internal losses of the battery, at a voltage level of 2.25 V per cell. The outputs required, in terms of current, will depend on the size of the battery.
Floating shelf charging station
For batteries that could not be shipped for several weeks, there is a necessity for keeping the battery fully charged until shipment. For such batteries, there are two options for trickle charging when waiting in the shelf. Either several batteries are connected in series and charged at a current density of 40 to 100 mA/100 Ah nominal capacity or there may be several individual circuits to charge each battery separately. All these batteries are float charged at a little over their OCV as discussed above.
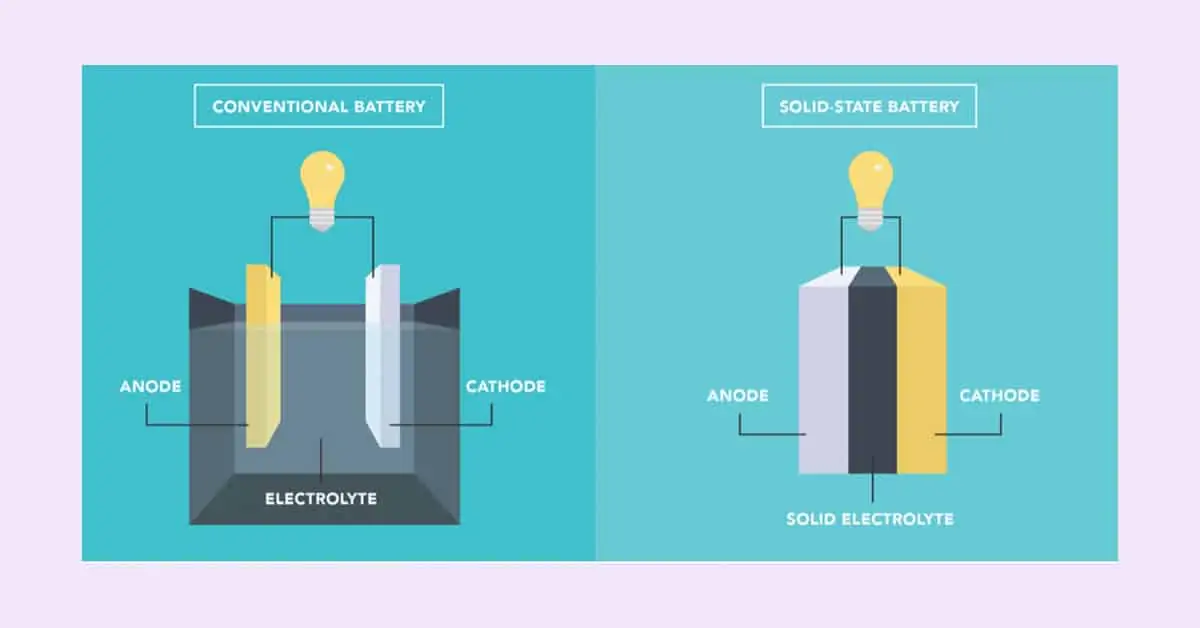
Float charging AGM VRLA batteries
Float charging of AGM batteries is not different from conventional flooded battery float charging. But there are several differences in the operation of the float charging process occurring in the two varieties.
VRLA batteries have low internal resistance and hence can accept charge extremely well in the initial part f the charging period.
A constant-potential, voltage-regulated and temperature-compensated charger is the best charger for VRLA batteries.
The CP float charging voltage is normally 2.25 to 2.30 V per cell. There is no limit for float charge current. But, for boost charging at a CP voltage of 14.4 to 14.7 for VRLA batteries, an initial maximum current of 30 to 40 percent of rated capacity in amperes is stipulated by most of the manufacturers (both flooded and VRLA type). A variation of ± 1 % on the float voltage value and ± 3 % for boost charge voltage are prescribed by most manufacturers.
[1. https://www.thebatteryshop.co.uk/ekmps/shops/thebatteryshop/resources/Other/tbs-np65-12i-datasheet.pdf 2. https://www.sbsbattery.com/media/pdf/Battery-STT12V100.pdf 3. https://eu.industrial.panasonic.com/sites/default/pidseu/files/downloads/files/id_vrla_handbook_e.pdf]
Temperature effects on float life of VRLA batteries
The temperature has a tremendous influence on the life of valve regulated lead acid batteries. For every 10°C rise in the operating temperature, the life expectancy is reduced by half. The figures given below confirm this fact. The float life at 20°C is about 10 years for a particular product of Panasonic. But at 30°C, the life is about 5 years. Similarly, the life at 40°C is about 2 years 6 months [Figure 10 in https://eu.industrial.panasonic.com/sites/default/pidseu/files/downloads/files/id_vrla_handbook_e.pdf].
Page 6 in http:// news.yuasa. co.uk/wp-content/uploads/2015/05/SWL-Shortform.pdf].
Hence if a consumer wants to go for a new battery, he should take into consideration the average ambient temperature and the life at that temperature. If he wants a battery to last for 5 years at 30 to 35oC, he should go for a battery designed for 10 years life at 20oC.

Fig 1 Float life at different temperatures of Panasonic VR products
https://eu.industrial.panasonic.com/sites/default/pidseu/files/downloads/files/id_vrla_handbook_e.pdf

Fig 2 Float life at different temperatures of Yuasa (UK) VR products
http://news.yuasa.co.uk/wp-content/uploads/2015/05/SWL-Shortform.pdf
British Standard 6240-4:1997, gives the dependence of life on temperature between 20 and 40°C.
Cyclic life of VRLA batteries
As compared with float life the cyclic lives of VR batteries will be shorter because of the amount of active materials used per cycle. In float operation, the batteries are called upon to supply power only when there are power disruptions. But, in the cyclic mode, the battery is discharged to the required depth of discharge (DOD) every time and charged immediately. This discharge followed by the charge is termed a “cycle”. The cycle life depends on the amount of materials converted per cycle, i.e., DOD. The lower the conversion, the higher is the life. The following table shows the lives of Panasonic VRLA products to 60 % and 80 % capacity end of life DOD for three DOD levels.
Table 2. Approximate life cycles of Panasonic VRLA products to 60 % and 80 % end of life DOD for three DODs at an ambient temperature of 25oC. [Adapted from https://eu.industrial.panasonic.com/sites/default/pidseu/files/downloads/files/id_vrla_handbook_e.pdf Figure on page 22]
DOD to end of life | Life cycles at 100 % DOD | Life cycles at 50 % DOD | Life cycles at 30 % DOD |
Life to 60 % DOD | 300 | 550 | 1250 |
Life to 80 % DOD | 250 | 450 | 950 |
- Temperature and Float current
Table 3. Float current at 2.3 V per cell for three types of lead-acid cells at different temperatures
[[Adapted from C&D Technologies https://www. cdtechno. com/pdf/ref/41_2128_0212.pdf
Figure 19, Page 22]
| Temperature, °C | Approximate current, mA per Ah20 |
Flooded calcium cells | 25 | 0.25 |
| 30 | 0.35 |
| 40 | 0.6 |
| 50 | 0.9 |
| 60 | 1.4 |
Gelled VR cells | 25 | 0.6 |
| 30 | 0.75 |
| 40 | 1.5 |
| 50 | 3 |
| 60 | 6 |
AGM VR Cells | 25 | 1.5 |
| 30 | 2 |
| 40 | 3.5 |
| 50 | 8 |
| 60 | 15 |
- Test for suitability for float operation [IEC 60896-21 and 22:2004]
IEC gives a test procedure for checking the suitability of VR cells for float operation. The cells or batteries shall be subjected to a floating voltage of VFloat which shall be specified by the manufacturer in the typical range of 2.23 to 2.30 VOLTS PER CELL. The initial voltage of each cell or monobloc battery shall be measured and noted. After 3 months, the voltage of each cell or monobloc battery shall be measured and noted. After 6 months of floating operation, the cells or monoblocs shall be subjected to the capacity test. The actual capacity on discharge shall be greater than or equal to the rated capacity.
- Cell-to-cell float voltage variation
Due to the inherent process variables, the voltages of the individual cells or batteries are bound to vary over a range of float operating voltage. Minute differences in the inner parameters of the plates like the weight of active materials, the porosity of active materials, and differences in plate compression and AGM compression, variation in the volume of electrolyte, etc. cause this variation. Even with strict quality control steps (both in materials and process controls in the unit operations), the VR products show cell-to-cell variations resulting in “bimodal” distribution of cell voltages during float operation.
In a conventional cell with excess flooded electrolyte, the two plates charge independently of each other. Oxygen and hydrogen gases have low diffusion rates in sulphuric acid solutions. The gases evolved during charging exit the cells because they do not have sufficient time to interact with the plates.
In VRLA cells the oxygen cycle phenomenon makes this picture complex. As in the case of flooded cells, water decomposition occurs on the positive plate; grid corrosion also occurs. Though some oxygen gas escapes from VR cells in the early stages of float charging (due to non-starved conditions), the creation of gas paths occurs after the saturation level reduces from the initial 90 to 95 % to lower levels.
Now, the reverse reaction of water decomposition which occurred on the positive plate begins to take place on the negative plate:
Water decomposition on PP: 2H2O → 4H+ + O2 ↑ + 4e–………………………. (1)
O2 reduction (= O2 recombination) on NP: O2 + 4H+ + 4e– → 2H2O + (Heat) ..…….…. (2)
[2Pb + O2 + 2H2SO4 → 2PbSO4 + 2H2O+ Heat] ..…… (3)
The following points can be noted from the above reactions:
- It is seen that the net result is the conversion of electrical energy to heat.
- Thus, when a VR battery enters the oxygen cycle stage, the batteries become warmer.
- Oxygen gas is not lost to the atmosphere
- Lead in the NAM gets converted to lead sulphate and so the potential of the NP becomes more positive; this will result in preventing hydrogen evolution
- To compensate for the decreased NP voltage, the positive plates become more positive and more oxygen evolution and corrosion occur (so that the applied float voltage is not altered). The oxygen thus produced will be reduced on the NP, which further experiences polarization resulting in a more positive potential for NP.
Because of the current draw for oxygen recombination, float currents are roughly three times higher for VRLA batteries than for flooded products, as has been pointed out by Berndt [D. Berndt, 5th ERA Battery Seminar and Exhibition, London, UK, April 1988, Session 1, Paper 4. 2. R.F. Nelson in Rand, D.A.J; Moseley, P.T; Garche. J ; Parker, C.D.(Eds.) Valve-Regulated Lead- Acid Batteries, Elsevier, New York, 2004, Chapter 9 , page 258 et seq.].
Table 4. Float charging: Comparison of float currents, heat evolution, and heat removal for a vented and VRLA battery
Details | Flooded cell | VR Cells | Remarks |
Float voltage per cell, Volts | 2.25 | 2.25 | Same float voltage |
Equilibrium float current, mA/100 Ah | 14 | 45 | Approximately 3 times more in VR batteries |
Equivalent energy input, mW | 31.5 mW (2.25 V X 14 mA). | 101.25 mW (2.25 V X 45 mA). | Approximately 3 times more in VR batteries |
The heat removed via gassing, mW | 20.72 mW (1.48 V X 14 mA). (20.7/31.5 – 66 %) | 5.9 (1.48 V x 4 mA) (5.9/101.25 = 5.8 %) | One-tenth of flooded cells |
Heat balance, mW | 31.5-20.72 = 10.78 | 101.25 – 5.9= 95.35 |
|
Conversion of float charge current to heat, percent | 10.8 | 95 | Approximately 9 times in VR batteries |
- Gassing and charging voltage
Normally, the oxygen cycle efficiency at recommended float voltage recombines all the oxygen generated at the positive plate to water at the negative plate and hence no or negligible water loss occurs, and hydrogen evolution is inhibited.
But, if the recommended voltage or current is exceeded, gassing begins to occur. That is, the generation of oxygen exceeds the ability of the cell to recombine the gas. In extreme cases, both hydrogen and oxygen are evolved, and water loss occurs, accompanied by more heat generation.
Table 5. Gas emission and float current at different float voltages of gelled electrolyte VR cell, 170 Ah
[Adapted from C&D Technologies www. cdtechno .com/pdf/ref/41_2128_0212.pdf
Figure 17, Page 21]
Charging voltage, Volts | Approximate gas generation, ml per minute | Approximate gas generation, ml per Ah per minuteº | Approximate current, Amperes | Approximate current, milliamperes per Ahº |
< 2.35 | Nil | Nil | — | |
2.35 Gassing begins | — | — | 0.4 | 2.35 |
2.4 | 1.5 | 0.0088 | 0.45 | 2.65 |
2.46 | 3.5 | 0.0206 | 0.6 | 3.53 |
2.51 | 10 | 0.0588 | 1.4 | 8.24 |
2.56 | 24 | 0.1412 | 3 | 17.65 |
º Calculated values
- Charging voltage and current
Table 6. Float voltage vs. float current for gelled and AGM VRLA batteries
[Adapted from C&D Technologies www. cdtechno.com /pdf/ref/41_2128_0212.pdf
Figure 18, Page 22]
Float voltage (Volts) | Current, mA per Ah | |
Gelled VR battery | AGM VR battery | |
2.20 | 0.005 | 0.02 |
2.225 | 3 | 9 |
2.25 | 6 | 15 |
2.275 | 9.5 | 22 |
2.30 | 12 | 29 |
2.325 | 15 | 39 |
2.35 | 25 | 46 |
2.375 | 30 | 53 |
2.40 | 38 | 62 |
2.425 | 45 | 70 |
2.45 | 52 | 79 |
Table 7. Float current for flooded calcium, gelled, and AGM VRLA batteries at different temperatures for 2.3 volts per cell float charge
[Adapted from C&D Technologies www. cdtechno. com/pdf/ref/41_2128_0212.pdf
Figure 19, Page 22]
Cell temperature, °C | Current, mA per Ah20 | ||
Flooded calcium battery | Gelled VR battery | AGM VR battery | |
25 | 0.25 | 0.65 | 1.5 |
30 | 0.375 | 0.9 | 2 |
35 | 0.425 | 1.25 | 3 |
40 | 0.55 | 1.6 | 4.1 |
45 | 0.7 | 2 | 6 |
50 | 0.875 | 3.5 | 7.5 |
55 | 1.15 | 3.75 | 11.1 |
60 | 1.4 | 6 | 15 |
- Float voltage, operating temperature and life
Overcharging at higher than the recommended float voltage will drastically reduce the life of the batteries. This chart shows the effect on life of overcharging a gel battery.
Table 8. Percent cycle life of gel cells vs. recharge voltage (Recommended voltage for charge 2.3 to 2.35 V per cell)
www. eastpenn-deka. com/assets/base/0139.pdf
Recharge voltage | Percent cycle life of gel cells |
Recommended | 100 |
0.3 V more | 90 |
0.5 more | 80 |
0.7 more | 40 |
Ron D. Brost [Ron D. Brost, Proc. Thirteenth Annual Battery Conf. Applications and Advances, California Univ., Long Beach, 1998, pp. 25-29.] has reported the results of cycling on 12V
VRLA (Delphi) to 80% DOD at 30, 40 and 50 oC. The batteries were subjected to 100% discharge at 2-h at every 25 cycles at 25pC to determine the capacity. The results show that the cycle life at 30oC is about 475 while, the number comes down to 360 and 135, approximately at 40 and 50oC respectively.
The inter-relationship among float voltage, float temperature, and life
Figure 3. The dependence of float life on float voltage and float temperature
[Malcolm Winter, 3rd ERA Battery Seminar, 14 January 1982, London, (ERA Report No. 81-102, pp. 3.3.1. to

- Electrolyte volume and temperature rise during float charge
The temperature rise during charge is the least in flooded cells and the most in AGM VR cells. The reason lies in the volume of the electrolyte the different types of cells have. The following table illustrates this fact. Because of the higher volume of electrolyte compared with AGM cells, the gel cells can withstand more deep discharge.
Table 9. Battery type and relative volumes of electrolytes
sv-zanshin .com/r/manuals/sonnenschein _gel_handbook_part1.pdf]
Flooded cells, OPzS | Gelled cells, Sonnenschein A600 cells | AGM cells, Absolyte IIP | Gelled cells, Sonnenschein A400 cells | AGM cells, Marathon M, FT |
1 | 0.85 to 0.99 | 0.55 to 0.64 | — | — |
— | 1 | 0.61 to 0.68 | 1 | 0.56 to 0.73 |
— | 1.5 to 1.7 | 1 | 1.4 to 1.8 | 1 |
- The voltage spread on float charge
The voltage spread in a string of float-operated VR batteries varies at different periods after the float charge begins. Initially, when the cells are having more electrolyte than the starved condition, the cells would be experiencing higher voltages and those with good recombination will exhibit lower cell voltages (due to decreased negative plate potentials); Cells with a higher volume of acid will have polarized negative plates which will exhibit higher cell voltages leading to hydrogen evolution.
While the sum of all the individual cell voltages is equal to the applied string voltage, the individual cell voltages will not be the same for all; some will have higher voltages (due to non-starved condition and hydrogen evolution) than the impressed per-cell voltage and others will have lower voltages (due to oxygen cycle). An example
of this phenomenon is given by Nelson [1. R.F. Nelson in Rand, D.A.J; Moseley, P.T; Garche. J ; Parker, C.D.(Eds.) Valve-Regulated Lead- Acid Batteries, Elsevier, New York, 2004, Chapter 9 , page 266 et seq. 2. R.F. Nelson, Proceedings of the 4th International Lead-Acid Battery Seminar, San Francisco, CA, USA, 25–27 April 1990, pp. 31–60.].
Table10. Individual cell voltage-spread data for 300 Ah prismatic VR cells in a 48-V/600-Ah array floated at 2.28 volts per cell.
[R.F. Nelson in Rand, D.A.J; Moseley, P.T; Garche. J ; Parker, C.D.(Eds.) Valve-Regulated Lead- Acid Batteries, Elsevier, New York, 2004, Chapter 9 , page 266 et seq]
Original voltage | After 30 days’ float charge | After 78 days’ float charge | After106 days’ float charge | ||||
Voltage range, V | Spread, mV | Voltage range, V | Spread, mV | Voltage range, v | Spread, mV | Voltage range, V | Spread, mV |
2.23 to 2.31 | 80 | 2.21 to 2.37 | 160 | 2.14 to 2.42 | 280 | 2.15 to 2.40 | 250 |
It can be seen that some cells may go to the gassing stage (2.42 V) and some lower than the impressed voltage of 2.28 V per cell.
Some authors believe that cell voltages stabilize within six months of float operation and the variation in cell voltages will be within ±2.5% of the mean value. This means that for the mean value of 2.3
VOLTS PER CELL, the variation will be in the range of 2.24 – 2.36 (i.e., 60mV less or more for 2.3V operation). [Hans Tuphorn, J. Power Sources, 40 (1992) 47-61]
Figure 4. Variation of the cell to a cell voltage of a new 370V UPS Battery float charged with float voltage = 2.23 Vpc
[Hans Tuphorn, J. Power Sources, 40 (1992) 47-61]

- Float charging and the importance of controlling the cell voltages:
It is very essential to control the cell voltages during float charge periods. Experiments conducted on a 48V/100Ah telecommunication VR battery illustrate this fact.
The cells were floated at 2.3 V per cell with a current of 0.4 − 0.6 mA/Ah and the temperature of the end
cells, centre cell and surroundings were equal). The float voltage for the string is 2.3 V x 24 cells = 55.2 V.
Table 11. 2.3 V Float charging of Telecommunication batteries 48 V, 100 Ah batteries, with a current of 0.4 − 0.6 mA/Ah
[Matthews, K; Papp, B, R.F. Nelson, in Power Sources 12, Keily, T; Baxter, B.W.(eds) International Power Sources Symp. Committee, Leatherhead, England, 1989, pp. 1 – 31.]
No. of cells short-circuited | Voltage of the cells rises to, Volts | Float current increases to (mA per Ah) | Cell temperature raised by, °C | Duration to the increase of the said temperature, hours | Remarks |
One | 2.4 (55.2 ÷ 23) | 2.5 | 1 | 24 | No temperature rise |
Two | 2.51 (55.2 ÷ 22) | 11 | 5 | 24 | Minimal temperature rise |
Three | 2.63 (55.2 ÷ 21) | 50 | 12 | 24 | Begins to enter thermal runaway |
Four | 2.76 (55.2 ÷ 20) | 180 | 22 | 1 | Goes into a thermal runaway condition. H2S gas generated |
The above data indicate that short-circuiting of 1 or 2 cells would not be disastrous from a thermal point of view.
Provided that VR cells are not used in abusive conditions (e.g., > 60°C and high charging currents or float voltages higher than 2.4 V per cell), they do not emit H2S or SO2 gases. If these gases are produced, the surrounding copper and brass components and other electronic parts will get contaminated and tarnished. Thus, it is essential to monitor the cell voltages of batteries on the float.
- Thermal runaway
High float voltages and float currents lead to higher cell temperatures. Hence, good ventilation is a must for all types of batteries. When the temperature produced inside a VR cell (due to oxygen cycle and other factors), cannot be dissipated by the cell system, the temperature rises. When this condition persists for a longer duration, dry-out of the electrolyte and temperature rise due to the generation of gases (O2 and H2) will lead to damage to the cell jar and bursting may occur.
The figures given below show some examples of the results of the thermal runaway phenomenon:


Figure 5. Thermal runaway effects
[https://www. cpsiwa. com/wp-content/uploads/2017/08/14.-VRLA-Battery-White-Paper-Final-1.pdf]
- Float Charging voltage and positive plate corrosion acceleration factor
Charging voltage has a great influence on VRLA life as the temperature. The corrosion rate of the positive gird depends on the potential at which the plate is maintained. Figure [Piyali Som and
Joe Szymborski, Proc. 13th Annual Battery Conf. Applications & Advances, Jan 1998, California State Univ., Long Beach, CA pp. 285-290] shows that grid corrosion rate has a minimum value range which is the optimum plate polarization level (i.e., 40 to 120 mV). This plate polarization level corresponds to an optimum float voltage setting. If the positive plate polarization (PPP) level is below or above the optimum level the grid corrosion rate increases rapidly.
Figure 6. Positive grid corrosion acceleration vs. positive plate polarization
[Piyali Som and Joe Szymborski, Proc. 13th Annual Battery Conf. Applications & Advances, Jan
1998, California State Univ., Long Beach, CA pp. 285-290]

- Plate potential and Polarization
The relationship between float voltage and positive plate polarization (PPP) is very important. Figure 7 shows an example of positive plate polarization (PPP) levels for various float voltages at four different temperatures. Polarization is the deviation from the open-circuit voltage (OCV) or equilibrium potential. Thus, when a lead-acid cell having an OCV of 2.14 V (OCV depends on the acid density employed to fill the battery (OCV = specific gravity + 0.84 V) is floated at a voltage of 2.21 V, it is polarized by 2210-2140 = 70 mV. The optimal plate polarization levels range between 40 and 120 mill volts. The recommended float voltage is 2.30 V per cell.
Figure 7. Example of Float voltage effects on positive plate polarization [Piyali Som and Joe Szymborski, Proc. 13th Annual Battery Conf. Applications & Advances, Jan 1998, California State Univ., Long Beach, CA pp. 285-290]

- Float charging a car battery
If one wants to float charge a car battery (or automotive starter battery or SLI) battery, he should go for a constant-potential charger which can also set the current limit. The onboard automotive system is designed to charge the car battery in a modified constant-potential charge mode. This mode will never allow the battery to exceed the set voltage limit and so it is safe.
The duration to completely charge the car battery depends on its state of charge, i.e., whether the battery is fully discharged or half-discharged or fully discharged and left for a few months without a recharge.
Depending on the current rating (ampere rating) of the charger and the capacity of the battery, a few hours or more than 24 hours.
For example, a car battery of 12V, 60 Ah capacity, if fully discharged, can be recharged in 25 to 30 hours provided the charger is capable of charging the battery at 2 to 3 amperes.
If you do not know the Ah capacity, you can find out the capacity by several methods:
- From the label on the battery
- Know the model of the battery for that particular car from the dealer.
- From the reserve capacity (RC) rating if given on the battery
- From the CCA (cold cranking amperes) rating if given on the battery (Refer Indian Standard or any Starter battery standard which gives the RC and CCA ratings. Example IS 14257).
Accordingly, we can adjust the time of charging.
It is always advisable to disconnect the battery from the charger when it is fully charged. The voltage will remain constant if the battery is fully charged. Also, the ammeter on the charger will show a very low current in the range of 0.2 to 0.4 ampere constant for two to three hours.
- Float charging LiFePO4 batteries
The charging of VR batteries and LiFePO4 are batteries are similar in the aspects:
- Stage 1: Both can start the charge in a constant current (CC) mode (up to 80 % input)
- Stage 2: Shift to CP mode once the set voltage is reached (Full charge)
- Stage 3: The third stage is trickle charge (Optional in the case of VR cells and not needed in the case of LiFePO4 cells due to the risk of overcharge and the accompanying deleterious reactions at both the electrodes).
The difference in the first stage for the two types of batteries is the charging current. In the case of LiFePO4 cells, the current can be as high as 1 C amperes. But in the case of VR batteries, a maximum of 0.4 C A is recommended. Therefore, the first stage duration will be very short in the case of LiFePO4 batteries, as low as one hour. But in the case of VR batteries, this stage will take 2 hours at 0.4 C A and 9 hours at 0.1 C A.
As in the first stage, the second stage also takes lesser time in the case of LiFePO4 cells (as low as 15 minutes), whereas it takes 4 hours (0.4 C A) to 2 hours (0.1 C A).
Hence overall, the LiFePO4 cells take about 3 to 4 hours while VR cells take 6 hours (at 0.4 C A and 2.45 V CP charge) to 11 hours (at 0.1 C A and 2.30 V CP charge)
Figure 8. Constant-voltage charge of Panasonic VR cells at 2.45 V and 2.3V per cell at different initial currents [https://eu.industrial. panasonic.com/sites/default/pidseu/files/downloads/files/id_vrla_handbook_e.pdf]

Notes:
Test Conditions:
Discharge: 0.05 C A constant-current discharge (20 h rate)
Cut-off voltage: 1.75 V per cell
Charge: 2.45 V per cell —————–
2.30 V per cell ___________
Temperature: 20°C
Figure 9. VRLA battery charging profile
[https://www. power-sonic. com/blog/how-to-charge-lithium-iron- phosphate-lifepo4-batteries/]

Figure 10. LiFePO4 battery charging profile
[https://www. power-sonic.com/blog/how-to-charge-lithium-iron-phosphate -lifepo4-batteries/]

As mentioned in the beginning, the trickle charge stage is not necessary for LiFePO4 cells. It may be needed for VR cells after a storage period of a few months. But if any time use is envisaged, the VR cells can be put on trickle charge at 2.25 to 2.3 V per cell.
The LiFePO4 cells should not be stored at 100 % SOC and it is enough if they are discharged and charged to 70 % SOC once in 180 days to 365 days of storage.
Charging voltage (for example 4.2 V per cell maximum) should be controlled to within ± 25 to 50 mV per cell, depending on the cell chemistry, cell size, and manufacturer. A current of 1C amperes is applied initially until the cell voltage limit is attained. Thereafter the CP mode is switched on. When the maximum voltage is approached, the current comes down at a steady rate till charging is ended at a current of approximately 0.03 C, depending on the cell´s impedance. With an initial current of 1 C amperes, a lithium-ion cell achieves full charge in 2.5 to 3 hours.
Some manufacturers permit increasing the initial current to 1.5 C amperes. But 2.0 C amperes initial current is generally not allowed by the manufacturers, because the higher currents do not decrease the charge time appreciably. [Walter A. van Schalkwijk in Advances in Lithium-Ion Batteries, Walter A. van Schalkwijk and Bruno Scrosati (Eds.), Kluwer Academic, New York, 2002, Ch 15, page 463 et seq.]
Although very short-time recharges are claimed for LiFePO4 cells, it should be noted that the investment will be very high for such a charger considering the wattage of the charger.
In practical terms, we can charge a 100 Ah Li-ion battery at 100 amperes (1C amperes) while an equivalent VR battery can be charged at a maximum of 40 amperes (0.4 C amperes). The tail end current for Li cells would be for this battery 3 amperes, while for VR battery the end of charge float current would be about 50 mA. The overall charge duration will be 3 to 4 hours for a Li cell and a VR cell, it would be about 10 hours.
There is no need for a trickle charge for Li cells while for VRLA cells, they may need a trickle charge after 3 to 4 months. VR cells can be stored at 100 % SOC, while Lithium cells must be stored at less than 100 % SOC.
Fully charged Li-ion cells should not be further charged. Any current supplied to a fully charged Li-ion battery will result in damage to the battery. A little overcharge can be tolerated, but the extreme conditions will lead to bursting and firing if not protected by the battery management system (BMS)
For further reading please refer to https://battlebornbatteries.com/charging-battleborn-lifepo4-batteries/
https://www.electronicsweekly.com/market-sectors/power/float-charging-lithium-ion-cells-2006-02/
Figure 11. Stages of charge for a standard Li-ion charge algorithm
[Walter A. van Schalkwijk in Advances in Lithium-Ion Batteries, Walter A. van Schalkwijk and Bruno Scrosati (Eds.), Kluwer Academic, New York, 2002, Ch 15, page 464.]

- Float charging lithium ion batteries – float voltage lithium ion
Float charging is not needed for Li-ion batteries. They should not also be stored in a fully charged condition. They can be discharged and charged to 70 % SOC once in 6 to 12 months if long storage is envisaged.
float charging and trickle charging
- What is the difference between trickle charging and float charging?
Trickle charging is a maintenance charge to top up the charge. A maintenance charge compensates only for self-discharge. Depending on the age and condition of the battery, a current density of 40
to 100 mA/100 Ah nominal capacity may be needed during the maintenance charge (trickle charge). These batteries should be recharged after each discharge. Once the battery is fully charged, it should be disconnected from the charger. Otherwise, the battery will be damaged.
The float charge is a continuous constant voltage charge and the battery is always prepared to supply the power needed as it is always in a fully charged condition.
How long can you float charge a battery?
Float charge voltages are kept at a value high enough to compensate for the battery’s self-discharge and to maintain the battery in a fully charged condition at all times but lower enough to minimize the corrosion of the positive grid. The charge current depends to a large extent on the load profile. The current will be higher after a load shedding. The batteries never get overcharged in this mode. When idle for a long time, the float current would be 200 to 400 mA per 100 Ah capacity.
The battery is never disconnected from the charger. The battery floats across the charger bus.
- How to calculate float charging current
The float charger supplies current after sensing the battery voltage. So, there is no need to calculate the float charge current. Only, one can limit the initial inrush current to a maximum of 0.4 C amperes. Since the float charge is a constant-potential charger, it will automatically reduce the current to the required level. Rather, the battery will receive only what it wants. Normally all VR batteries are floated at 2.3 V per cell. The fully charged battery will receive only 0.2 to 0.4 A per 100 Ah battery capacity.
- Difference between boost and float charging
Boost charging is a relatively high-current charging method resorted to when a discharged battery is required to be used in an emergency when no other battery is available, and the SOC is not enough for
the emergency works. Thus, a lead-acid battery can be charged at high currents depending on the time available and the SOC of the battery. Since fast chargers are available nowadays, boost charging is familiar today. Normally such boost chargers begin charging at 100A and taper to 80A. The most important thing is that the temperature should not be allowed to exceed 48-50oC.
The float charge is a continuous constant potential charge at 2.25 to 2.3 V per VR cell. The float charge keeps the battery ready to supply power at any time required. The battery is always maintained at this level and after a power shedding, the charger supplies a high current, which tapers to about 0.2 to 0.4 A per 100 Ah battery capacity when the battery is fully charged.
- Absorb charging and float charging
The constant-current charging in a CC-CP (IU) charging mode when the battery receives most of the input is called the “bulk charging stage” and the constant-potential mode charge during which the current tapers off is called the “absorption charging stage” and this CP mode charging voltage is called the absorption voltage.
Hope this article was of use to you. If you have suggestions or questions please feel free to write to us. Read float charging in Hindi in other languages menu. Please see the link for further reading on float charging